
The Mid-Year Review: Why the Summer Solstice is the Time to Audit Options-Overlay Risk
Defending Your Principal Base When Momentum Stalls

The mid-year checkpoint serves as a natural logical pause point for self-directed investors to audit system performance and examine portfolios for unexamined allocation drift. While underlying market conditions frequently appear stable during extended periods of low volatility, structural shifts in credit and equity dynamics materialize independently of calendar schedules.
The market session on Friday, June 5, 2026, provided a clear demonstration of how quickly momentum can stall. During that session, the Nasdaq-100 Index experienced a sharp single-session decline of 4.8%, driven by a rapid acceleration of selling within large-cap technology equities. This downward pressure extended directly into alternative asset classes that have attracted significant retail capital over the trailing twelve months, with physical gold, silver, and cryptocurrency instruments quickly retracing major portions of their year-to-date gains.
An examination of individual portfolio data shared within income-focused self-directed investment communities highlights a common structural vulnerability: the clustering of core equity, commodity, and alternative asset exposures within synthetic options-overlay vehicles. Data from recent community disclosures indicate highly concentrated weightings in products across three specific categories: equity covered call ETFs, commodity-overlay ETFs, and cryptocurrency income wrappers.
Specifically, funds like the NEOS Nasdaq-100 High Income ETF (QQQI), the Kurv Gold Enhanced Income ETF (KGLD), and the NEOS Bitcoin High Income ETF (BTCI) feature prominently in current individual investor sheets. I have recently observed portfolios where single-position allocations to a commodity options-overlay fund reached 10% of the portfolio, while broader options-income clusters comprised up to 30% of total portfolio value.
When underlying asset markets are flat or expanding moderately, collecting trailing distribution rates ranging from 13% on QQQI to approximately 28% on BTCI (based on fund-published tables in May/June 2026) appears to be a highly efficient income mechanism. However, the sharp pricing adjustments last week highlighted the structural risks embedded in these vehicles when underlying market momentum reverses. Within the Predictable Yield Engine (PYE) framework, these products are not inherently flawed, but they are highly role-specific tools that create significant risk when misplaced as core capital holdings.
1. The Capped-Upside / Full-Downside Asymmetry
Describing high-yield options-overlay ETFs as inherently defensive income instruments is misleading unless they are sized and monitored carefully. To understand their performance over a full market cycle, investors must explicitly separate three distinct layers: price return, NAV decay, and distribution support.
Options-overlay vehicles operate under a structural framework that introduces a fundamental capped-upside and full-downside asymmetry. When an underlying asset experiences a sudden, material price correction, the options-income fund absorbs the downside price return. While the exact relationship depends on delta, strike selection, volatility regimes, and timing, the fund’s Net Asset Value (NAV) drops in close tandem with the spot market sell-off.
The real structural impairment manifests during the subsequent market recovery phase, impacting long-term NAV decay. Because these funds systematically write call options against their underlying asset base to harvest the premiums required for high monthly payouts, their capital appreciation is capped at a predetermined strike ceiling. If the underlying index experiences a rapid, V-shaped rebound, the written call options trigger, preventing the fund from capturing the full value of the recovery.
An investor participates fully in the downward velocity of a market sell-off, but is structurally restricted on the upside. Over multiple market cycles, this operational mechanic can cause a long-term step-down in Net Asset Value. While the size and permanence of this NAV erosion vary by fund design and prevailing market regimes, it introduces a severe risk of yield dilution, as future distributions must ultimately be supported by a smaller principal base.
2. The Commodity Premium Trap
This structural asymmetry is not limited to equity call strategies; it applies identically to commodity options-overlay vehicles. A significant volume of self-directed capital has migrated into specialty funds like KGLD and the Kurv Silver Enhanced Income ETF (KSLV) under the assumption that these instruments provide a defensive, hard-asset ballast during equity market drawdowns.
This assumption misinterprets the mechanism driving the fund’s yield. Options-income commodity ETFs do not derive their distribution sustainability from the intrinsic, safe-haven properties of physical precious metals. They derive their yield from harvesting option premiums layered on top of the commodity’s price path. While the fund’s performance remains tied to the underlying spot metal price, the option strategy relies heavily on elevated implied volatility regimes to support its payout rates.
When a commodity enters an aggressive downward liquidation cycle, the cash generated from written option premiums is mathematically insufficient to offset the capital decay of the underlying asset. Investors holding these positions are not protected by a defensive real-asset shield; they are exposed to a complex combination of commodity beta and premium harvesting. If the underlying metal experiences prolonged price stagnation or sharp declines, the written calls trap the capital on the rebound exactly like an equity over-layer, locking in NAV erosion.
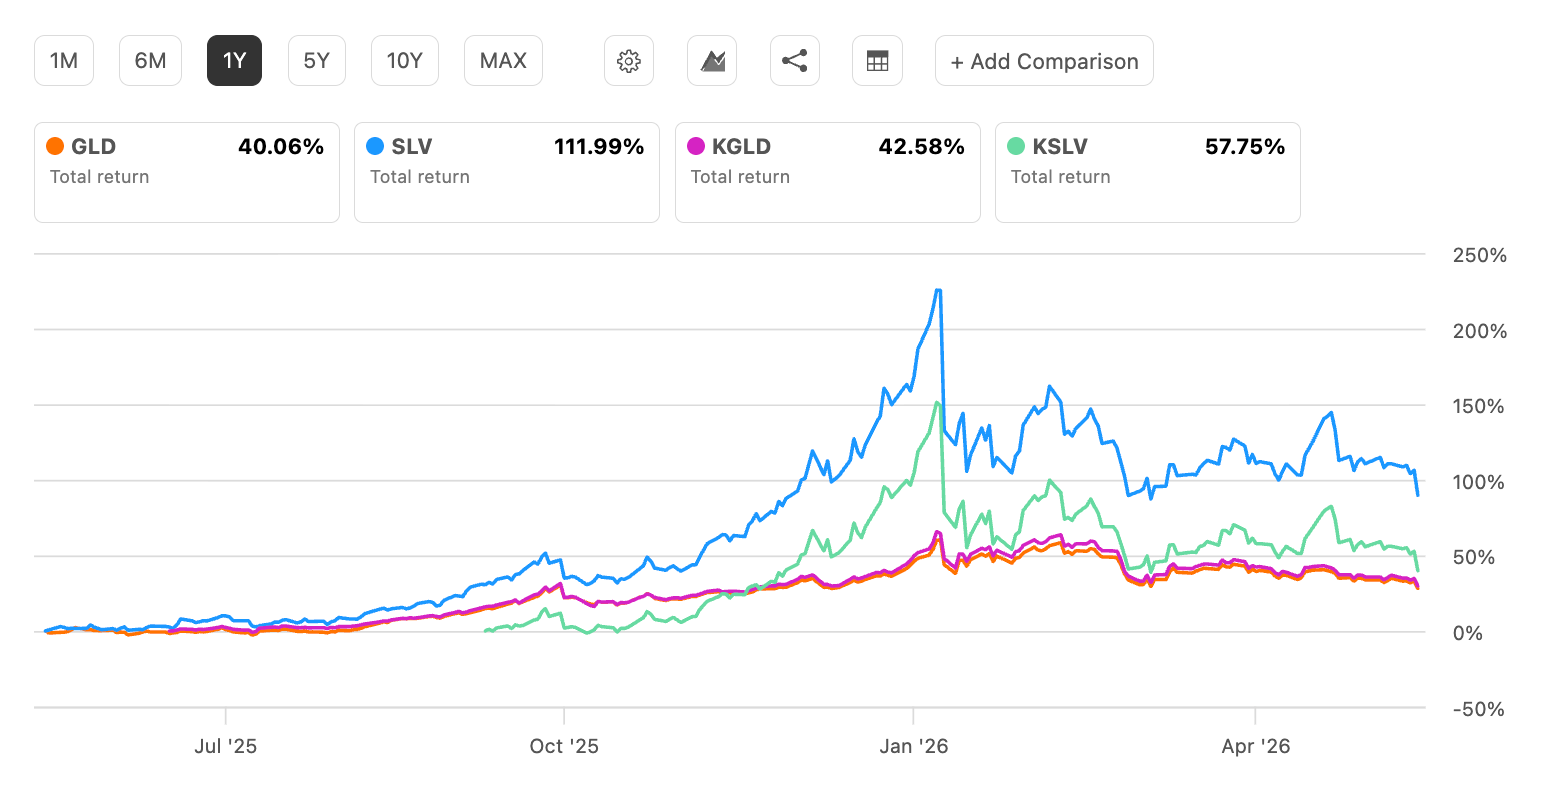
The performance metrics over the trailing twelve months leading into June 2026 provide an explicit, real-world demonstration of this mechanism. Consider the stark performance divergence captured in the data:
The Silver Asymmetry: When physical silver (SLV) surged toward a dramatic peak of 89.7% over the trailing year, the options-income version (KSLV) lagged significantly behind, capturing a total return of 39.8% because its written calls systematically capped the recovery upside on major vertical moves.
The Gold Premium Drag: Over the same trailing twelve-month period, physical gold (GLD) delivered a steady, low-volatility total return of 28.1%. Meanwhile, KGLD produced a nearly identical total return of 29.6%, yet forced investors to ride a wave of intense structural price swings and asset decay just to end up in the exact same economic position as the raw, un-levered metal.
As the chart demonstrates, when momentum breaks and a downward liquidation cycle takes hold, the written option premiums are mathematically powerless to prevent your capital from sliding. You are taking on equity-grade derivative risk for an asset class that is supposed to serve as your defensive ballast.
3. Shifting Allocation Weight Toward Contractual Seniority
Applying the PYE principle of role clarity requires separating opportunistic, high-volatility income extraction tools from the permanent foundational pillars of a portfolio. High-yielding options-overlay funds can accelerate cash generation in flat or grinding markets, but the structural error is using them as permanent core holdings.
A resilient income strategy enforces a clear division between volatile, synthetic yield structures and investments that offer contractually verified cash-flow visibility. As the mid-year checkpoint arrives, disciplined capital allocation requires a systematic evaluation of your reinvestment destinations.
For many self-directed income investors, a significant portion of monthly distributions is not re-invested at all; it is harvested to cover actual living expenses. This reality makes the remaining portion of cash flow that is earmarked for redeployment incredibly precious. The mechanic for this tactical sleeve is straightforward: harvest options distributions as cash, and actively redirect that cash into senior credit or infrastructure positions trading at fundamental discounts to NAV, rather than automatically compounding back into premium-priced synthetic structures.
Redirecting these options distributions into senior debt positions at a discount improves the quality and durability of the income base without requiring additional capital deployment. Lenders such as Ares Capital Corporation (ARCC) and Blackstone Secured Lending Fund (BXSL) do not rely on written option strike prices or volatility regimes to sustain their payouts. Their distributions are supported by senior-secured corporate loan agreements and measurable net investment income coverage.
To be sure, direct-lending BDCs have performed poorly over the last year in terms of price and are never immune to macroeconomic cycles, floating-rate compressions, or non-accrual risks. They require constant monitoring of credit underwriting quality and leverage metrics. However, because they possess structural seniority and clear cash-flow visibility, utilizing your excess options payouts to accumulate these credit assets, specifically when the market penalizes their stock prices and forces them to trade at a fair multiple or a discount represents a sound capital-allocation rule. This approach systematically improves the structural quality of the income base before market conditions deteriorate.
4. What’s Your Structure?
Market adjustments do not compromise an income engine that is anchored by strict entry discipline and rigid rules regarding coverage quality and reinvestment destinations. They simply expose the structural vulnerability of strategies that rely too heavily on unearned premium momentum.
As we cross the mid-year threshold, examine your portfolio layout and run a structural check in the comments section:
What is your portfolio’s exact allocation ratio between synthetic options-overlay wrappers and underlying contractual credit seniority or real asset infrastructure?
Based on current coverage metrics and NAV discount levels, into which specific core vehicles are you actively redirecting your monthly distribution cash flow?
Note: At the time of publication the author holds positions in GLD, ARCC and BXSL.
Predictable Yield Engine is for investors who want structure, not stock tips.
Paid subscribers get access to the full PYE Playbook: portfolio architecture, capital allocation rules, reinvestment discipline, and how I actually size and adjust risk through market cycles. If you’re building an income portfolio meant to compound over time, that’s what the subscription unlocks. Subscribe here to get full access.
Disclaimer
The analysis and commentary shared here reflect my own research and investment approach. This content is provided for informational and educational purposes only and should not be considered financial advice, a recommendation to buy or sell any security, or an endorsement of any particular strategy. Nothing here is tailored to the investment needs or circumstances of any individual. Charts, graphs, or figures are illustrative only and should not be relied upon as the basis for investment decisions. Please consult a qualified financial advisor before making investment choices that may affect your personal financial situation.