
PYE Weekend Update: What High Yield Is Telling Us Right Now.
This is Fully Unpaywalled for All Subscribers.

High yield is one of the cleanest places to read market risk appetite. It is not perfect, but it is useful. Equity investors can get carried away by narratives and multiple expansion. Credit investors are typically more clinical: they care about whether borrowers can pay interest, refinance debt, and survive the next turn in the cycle. I am publishing this special Weekend Update because the divergence between public market calm and private credit distress has reached a point that requires an immediate check on the plumbing. When the “risk-free” rate moves as fast as it has this week, we cannot wait for the monthly cycle to verify our assumptions.
The PYE Thesis: We are in a steady compounding environment. While the macro-liquidity of the credit market remains functional, micro-asset quality is showing early signs of fatigue. Credit is not breaking, but the margin for error is thin. At current spreads, the priority is to maintain discipline, collect income, and let the PYE filters identify the rising distress in lower-quality credits. This is not an environment for heroics: it is an environment for selective persistence and letting the engine do the work.
The Divergence: Public Calm vs. Private Cracks
The recent move in global government bonds matters because it changes the discount rate on everything else. UK 10-year gilt yields have pushed above 5%, reaching their highest levels since 2008 (with recent prints hitting 5.18%). While government rates have surged, the public U.S. high yield market has held firm. As of May 14, 2026, the ICE BofA U.S. High Yield OAS was 2.76%. The total return index stood at 1,889.31, up from 1,738.00 a year earlier.
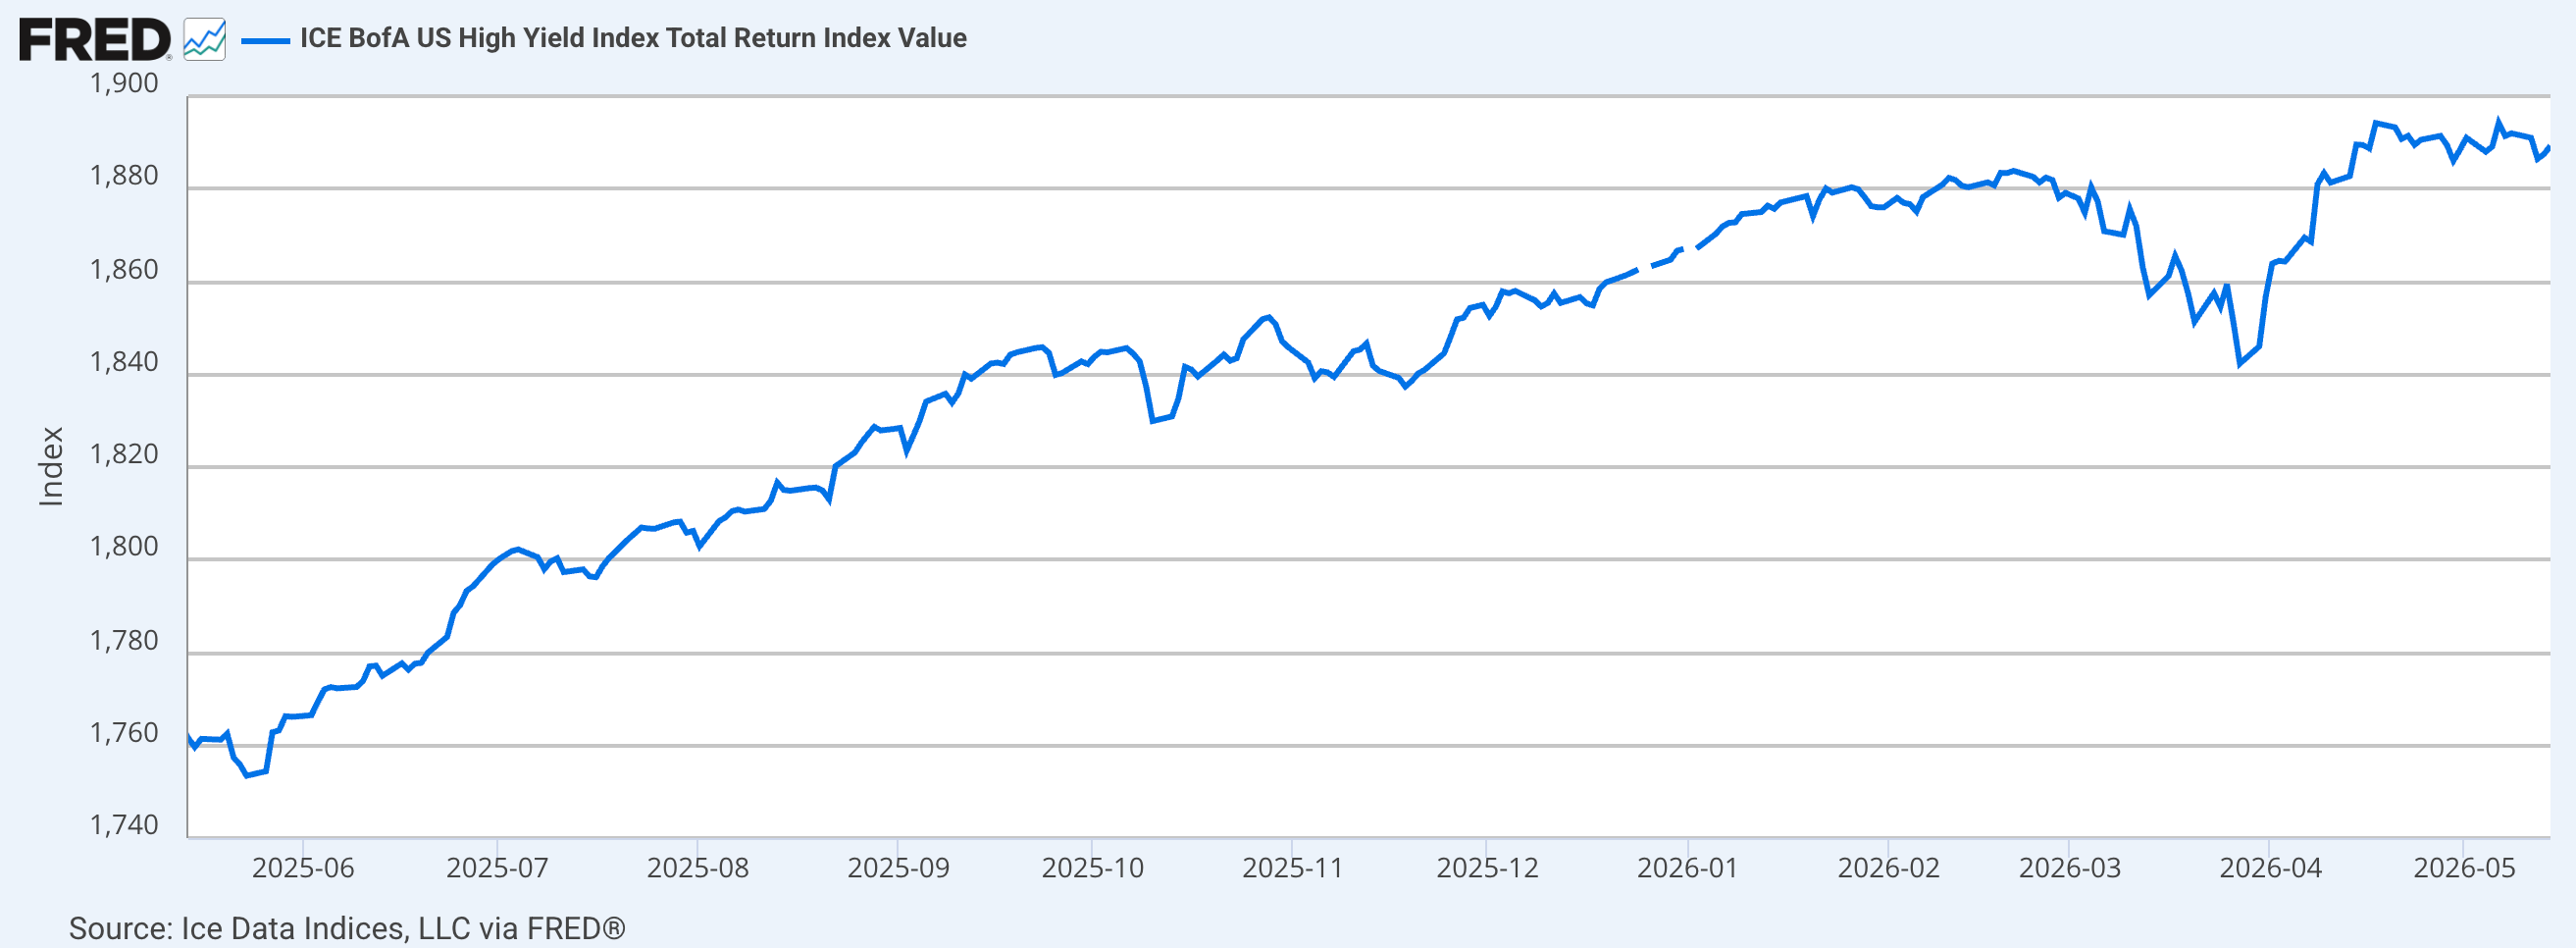
The chart above tracks the ICE BofA U.S. High Yield Index Total Return. Unlike a standard price chart, a total return index follows two components: the fluctuating market price of the bonds and the actual interest checks (coupons) paid out by the companies.
The index assumes every interest payment is immediately reinvested back into the market. Over the last 12 months, this engine has produced a total return of approximately 7.4%, with a very shallow maximum drawdown of only 2.2%. It effectively shows the steady compounding effect of high yield credit during a period of relative market calm.
Why this is helpful for income focused investors: For such investors, this chart serves as a noise filter. While news headlines may focus on volatility or economic narratives, this index provides a factual record of whether the credit market is actually functioning.
When this line is moving steadily upward, it tells us that despite any broader market jitters, companies are still successfully paying their interest and refinancing their debt. For those of us following the PYE playbook, this is the ultimate confirmation of income durability. It helps us stay focused on the boring reality of cash flow rather than getting swept up in equity market sentiment.
However, beneath this public calm, the private credit and BDC markets are showing signs of late-cycle stress. Industry average non-accruals for BDCs have climbed to 3.4% of cost. Payment-in-Kind (PIK) income has risen to an average of 8% of total investment income across the sector. This suggests that while public markets remain open, some private borrowers are struggling to meet cash interest obligations and should serve as a warning sign.
I) BDCs: The Filter is the Edge
The rise in non-accruals and PIK income means the “average” BDC is no longer a safe bet. Some managers have already begun marking down NAVs (Net Asset Values) by as much as 10% this quarter to reflect widening spreads and credit impairment.
The PYE Action: Maintain positions only in managers that clear our strict credit screens. Do not chase high headline yields if the underlying NAV is eroding.
The PYE Standard for BDCs:
Covered base dividends (net investment income must cover the payout without special dividends).
Stable or growing NAV per share (no significant unrealized losses).
Controlled PIK income (ideally well below the 8% industry average).
Low non-accruals (must remain below 2% at cost).
Entry at a discount or a justifiable, sensible premium.
II) REITs: Durable Income vs. Refinancing Risks
High yield spreads suggest the funding window is open, but the spike in Gilt and Treasury yields creates a “refinancing wall” for levered property owners.
Bucket One (Durable Income): Industrial, logistics, and data center exposure. These belong in the portfolio when cash flow is covered, leases are long-term, and valuation is sensible relative to historical NAV.
Bucket Two (Refinancing Risks): Older office and stressed retail. These fail the PYE screen (unless on discounts which more than offset the risk and have already baked in downside risk) when debt maturities are heavy in the next 18 months and the dividend is not fully supported by current operations.
III) Equities: Focus on Payout Durability
Calm high yield can support the equity backdrop, but it does not make weak payouts safer. If you are using PYE, the focus is on cash flow profile rather than price targets.
Covered-call structures and dividend growers can both fit the playbook, but only when the payout is supported and the cash flow profile is clear. A high headline yield with eroding NAV is a yield trap. In this environment, yield is a tool, not a target.
IV) CLOs, Preferreds, and CEFs: Structural Ballast
For the structural sleeve of the portfolio, the rule remains: let the structure earn its keep.
CLOs: CLO debt serves as a ballast sleeve while loan sentiment remains healthy. However, CLO equity requires caution as NAV total return lags. Income is not proof of durability.
CEFs: These belong in the engine only when the discount to NAV is attractive relative to historical averages. If the discount has closed, we hold through with valuations intact but do not aggressively add.
Preferreds: These are ballast, not a chase for yield. Bank-specific preferreds should be judged based on Tier 1 capital levels and regulatory cushions.
Verdict
The credit market is telling us that the financial plumbing is still functioning, even as global government bonds hit multi-year highs. This supports the durability of our income.
But we cannot be lazy. With BDC non-accruals at 3.4% and PIK rising, the cushion for disappointment is thin. This is a time to watch the metrics that matter: NAV stability, dividend coverage, and non-accruals. We are staying invested and collecting the coupon, but we are not stretching for yield. We are letting the PYE filters do the heavy lifting.
Predictable Yield Engine is for investors who want structure, not stock tips.
Paid subscribers get access to the full PYE Playbook: portfolio architecture, capital allocation rules, reinvestment discipline, and how I actually size and adjust risk through market cycles. If you’re building an income portfolio meant to compound over time, that’s what the subscription unlocks. Subscribe here to get full access.
Disclaimer
The analysis and commentary shared here reflect my own research and investment approach. This content is provided for informational and educational purposes only and should not be considered financial advice, a recommendation to buy or sell any security, or an endorsement of any particular strategy. Nothing here is tailored to the investment needs or circumstances of any individual. Charts, graphs, or figures are illustrative only and should not be relied upon as the basis for investment decisions. Please consult a qualified financial advisor before making investment choices that may affect your personal financial situation.
Excellent article/summary Andy! Have a great weekend.
Update: The latest weekly data sharpens the point. High yield had a weak week, with the broad HY index down 0.49%, but the move was not really a spread blowout. HY yield-to-worst rose from 6.94% to 7.17%, while option-adjusted spreads moved only 1 basis point wider, from 266 to 267 bps. That tells me this was mostly all-in yield repricing, not a sudden default scare. The warning light remains further down the quality ladder, where CCC spreads and yields sit much closer to the top of their 52-week range.